Automated Proteomics Pipeline for Neurodegeneration Biomarker Discovery
Automated R pipeline from MaxQuant output to differential expression and ML-based biomarker discovery. 70% reduction in data cleaning time, deployed at LCSB University of Luxembourg.
Automated Proteomics Pipeline for Neurodegeneration Biomarker Discovery
Stack: R · DEP · limma · tidyverse · ggplot2 · MaxQuant · Python · Git Repository: github.com/SLopezBegines/Proteomics
Problem
Large-scale proteomics datasets from neurodegeneration studies required extensive manual curation before statistical analysis, creating bottlenecks and reproducibility risks. Processing a single dataset could take days of repetitive cleaning and validation work.
Solution
Built an automated R pipeline for MaxQuant label-free quantification output — covering data cleaning, normalization (VSN), differential expression (DEP/limma), and visualization. Integrated cross-validation frameworks for ML-based biomarker discovery. Each analysis is configured through a single RMarkdown file; modular scripts are reused without modification across datasets.
Result
70% reduction in data cleaning time. Pipeline deployed at LCSB (University of Luxembourg) across multiple neurodegeneration datasets. Contributed to peer-reviewed publications in high-impact journals.
Overview
A modular and reproducible R pipeline for analyzing label-free quantitative (LFQ) proteomics data from Orbitrap and Q-Exactive mass spectrometers. The pipeline processes MaxQuant output through a complete analytical workflow: data cleaning, mixed imputation, differential expression analysis, and multi-layered functional enrichment.
Each analysis is configured through a single RMarkdown file that defines organism parameters and experimental design, then calls reusable modular scripts. This architecture allows rapid deployment on new datasets without code modification.
Technical Approach
Proteomics experiments generate complex datasets with systematic missing values, batch effects, and thousands of protein measurements across conditions. Standard tools handle individual steps but lack integration. This pipeline addresses:
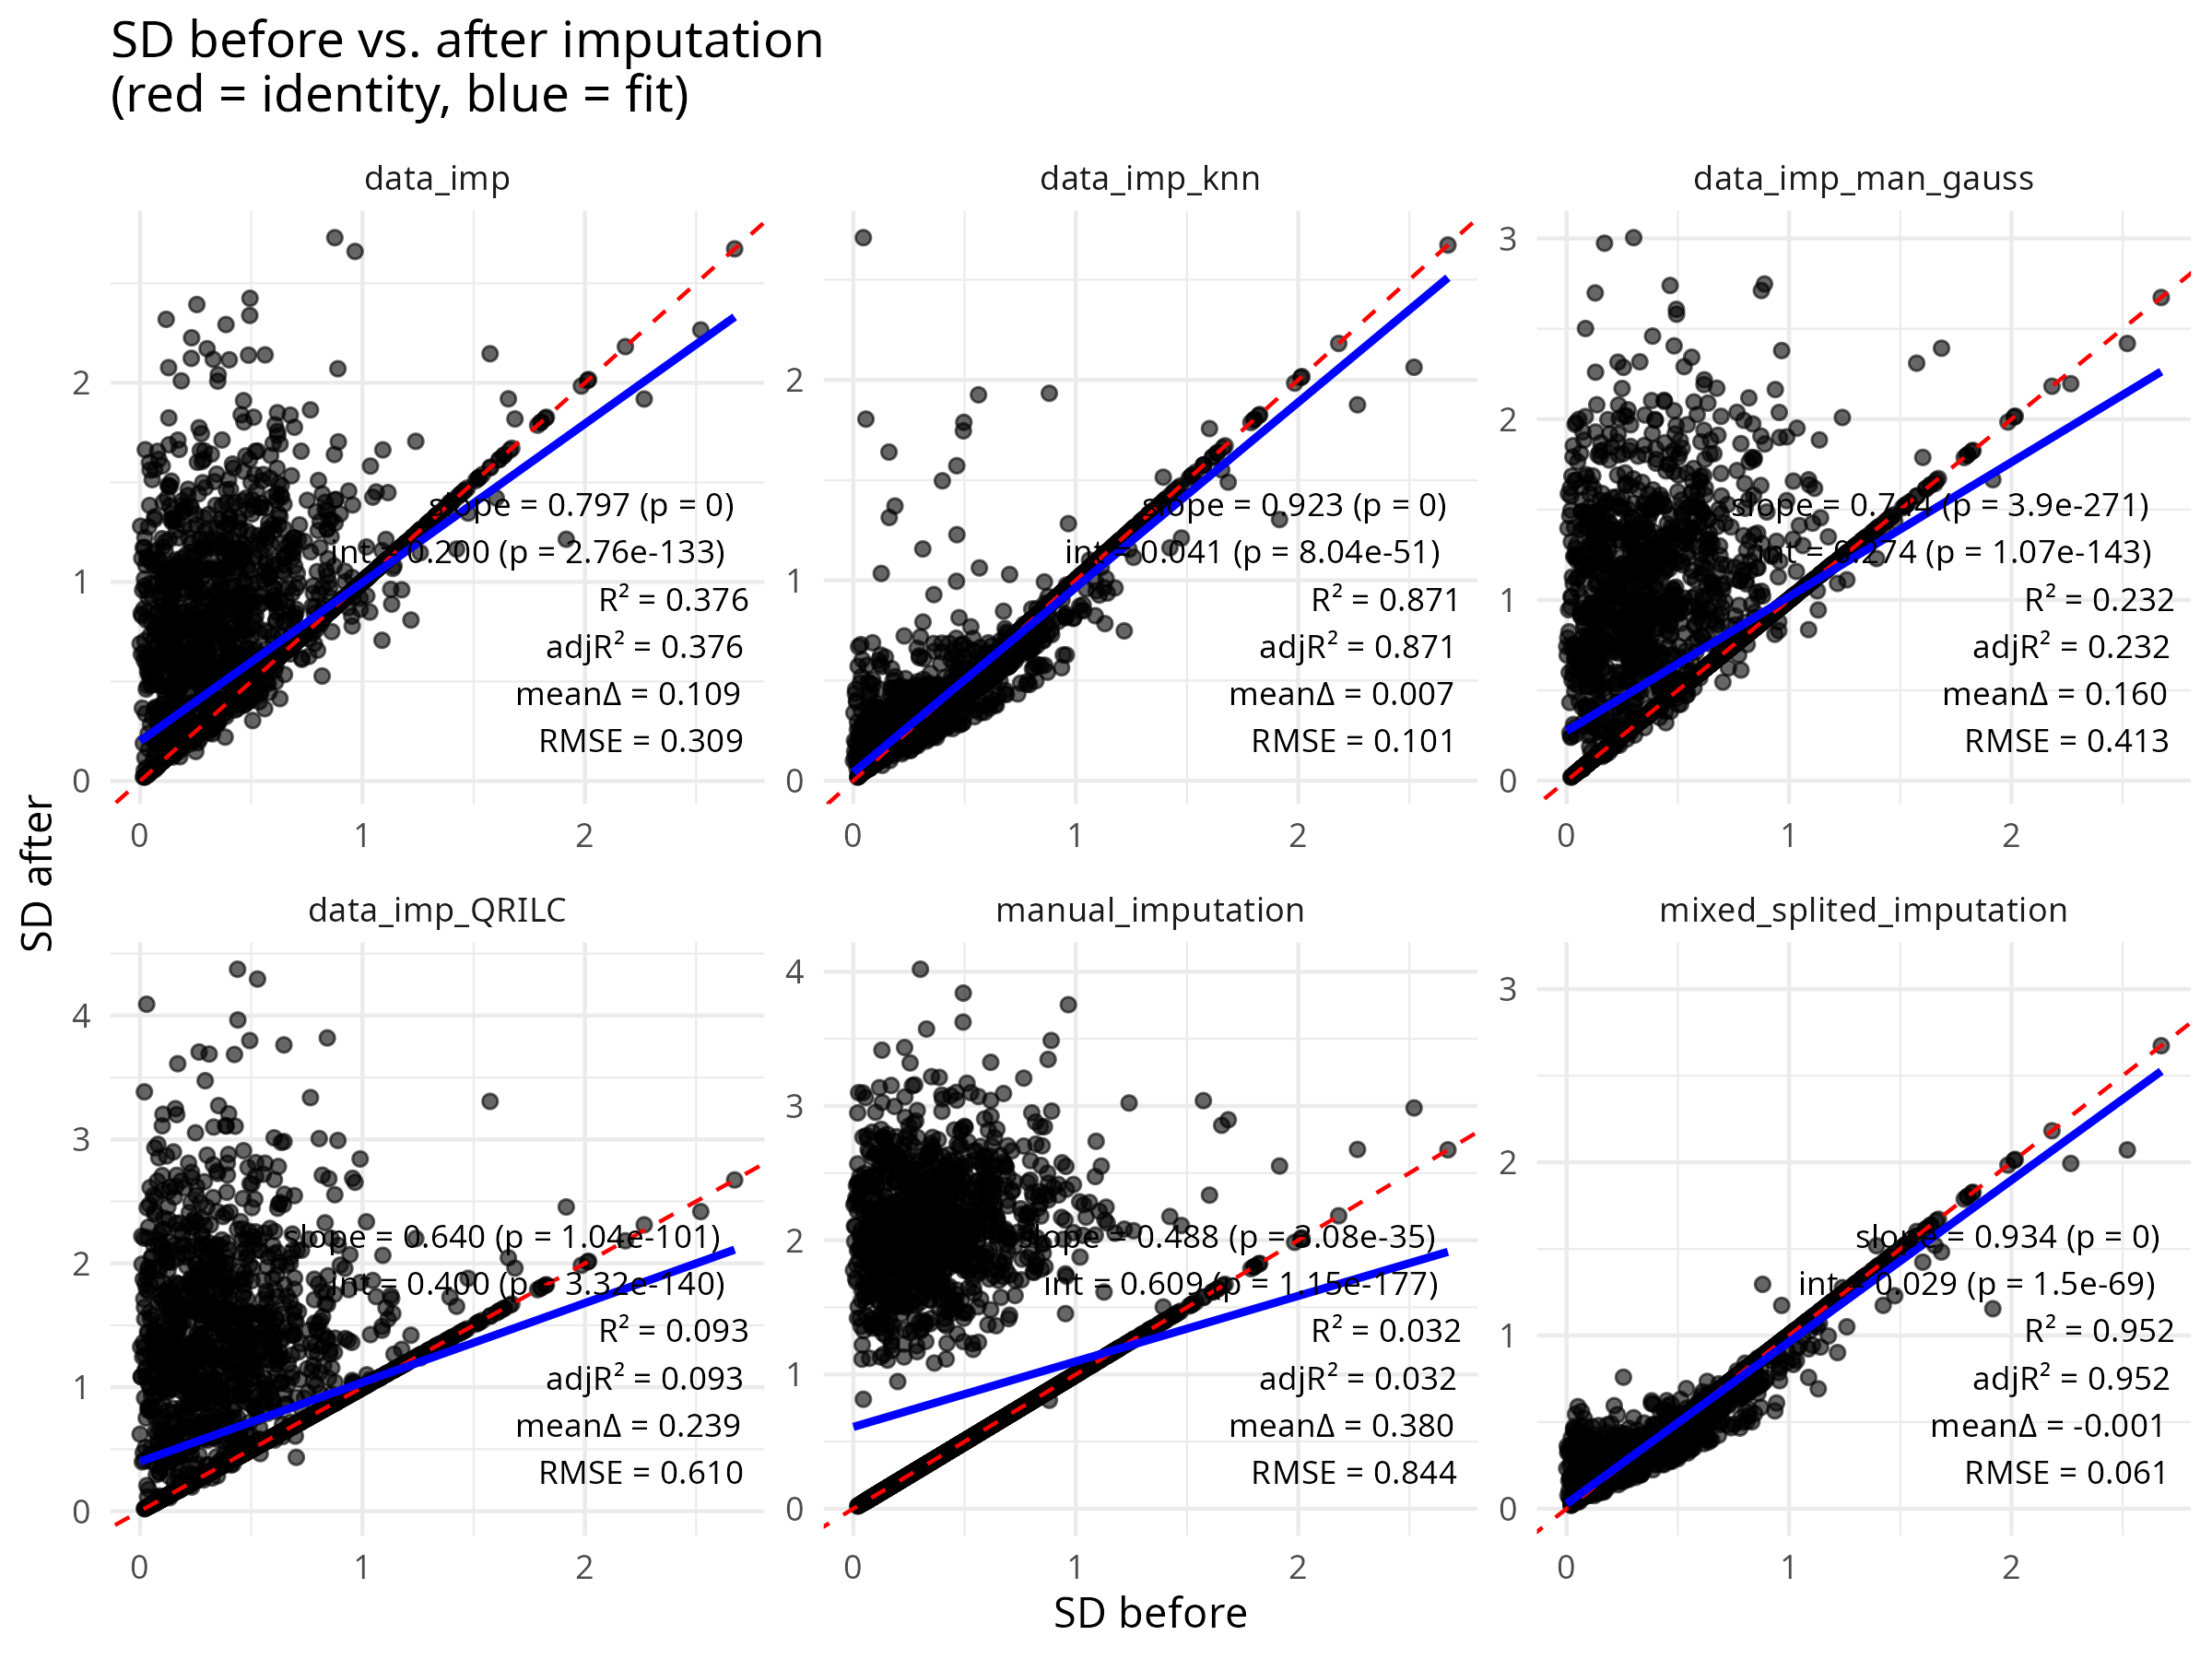
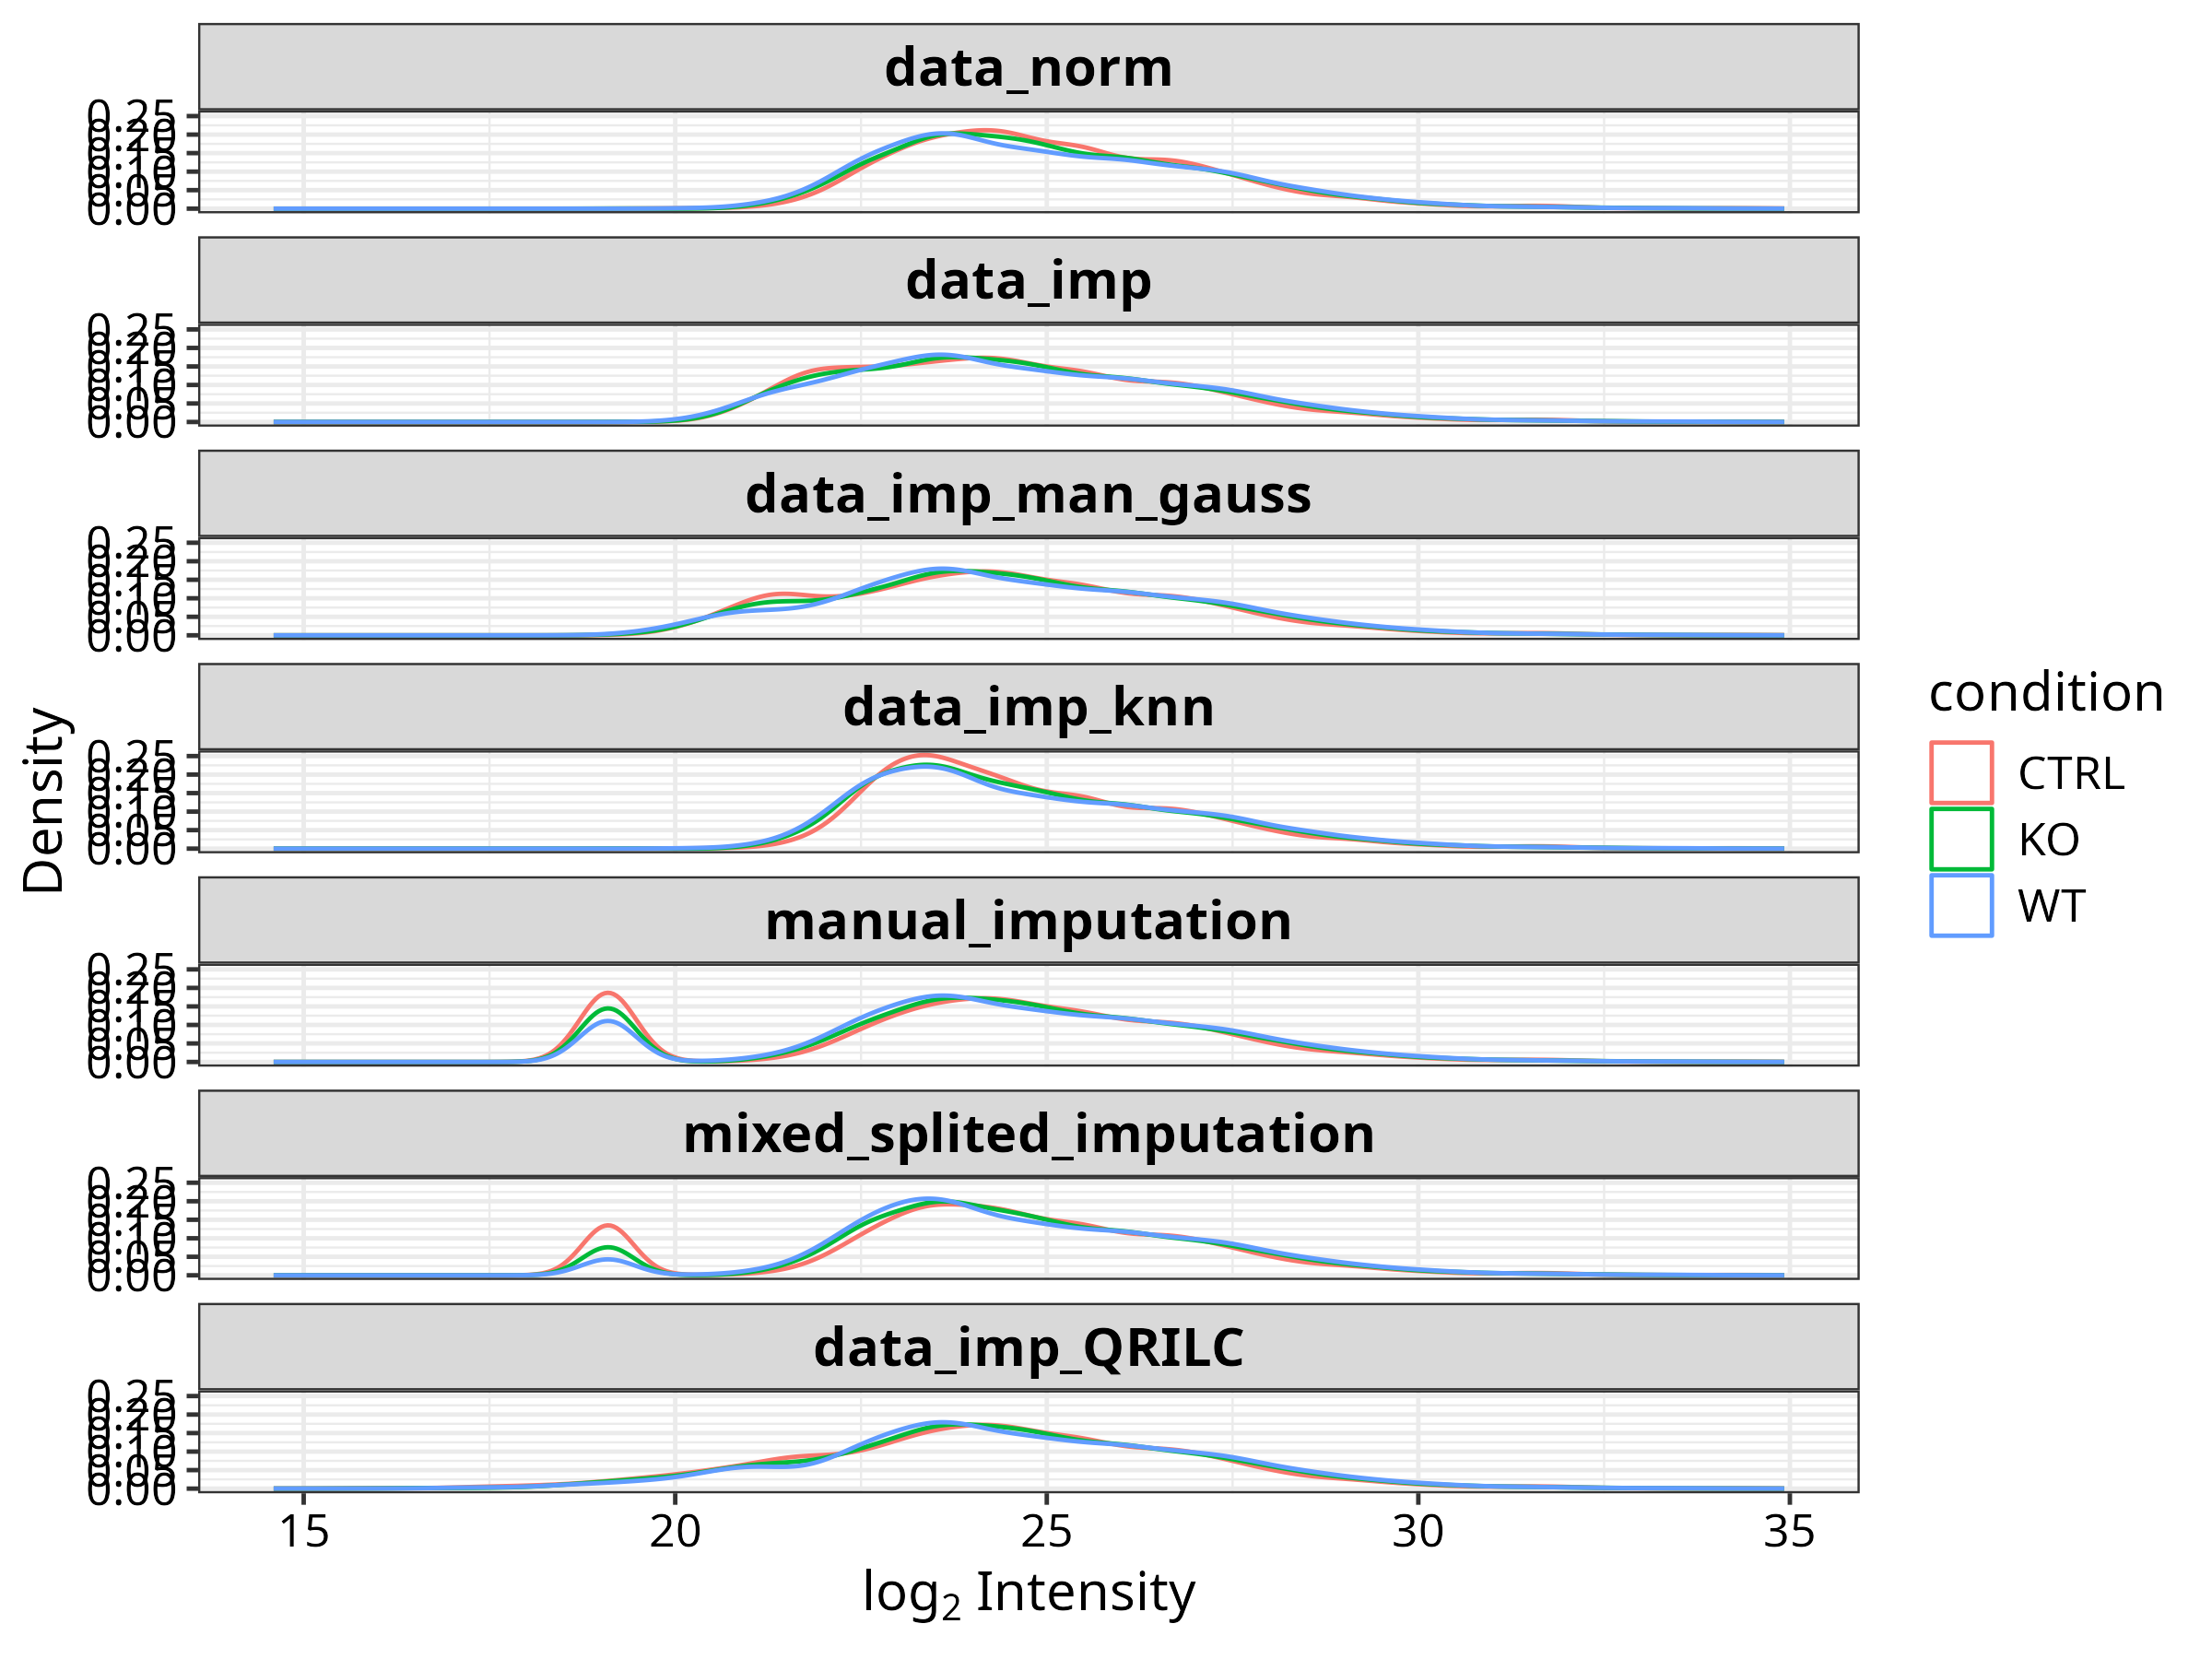
- Missing value heterogeneity — Implements a mixed imputation strategy that distinguishes MNAR (below detection limit) from MAR (randomly absent) proteins, applying appropriate methods for each type.
- Reproducibility — Modular scripts with centralized parameter control ensure consistent processing across datasets.
- Multi-organism support — Configurable for human, mouse, and zebrafish without pipeline modification.
Analytical Workflow
flowchart TD
A["📥 MaxQuant output · ProteinGroups.txt / .xlsx"] --> B
subgraph QC ["1 · QC & Preprocessing"]
B["Load & standardise columns · Remove contaminants"]
B --> C["Define experiment design · conditions · replicates · contrasts"]
C --> D["Filter missing values · fraction_NA threshold per condition"]
D --> E["VSN normalisation"]
E --> F["Mixed imputation · MNAR → zero/MinProb/QRILC · MAR → kNN"]
end
subgraph DE ["2 · Differential Expression"]
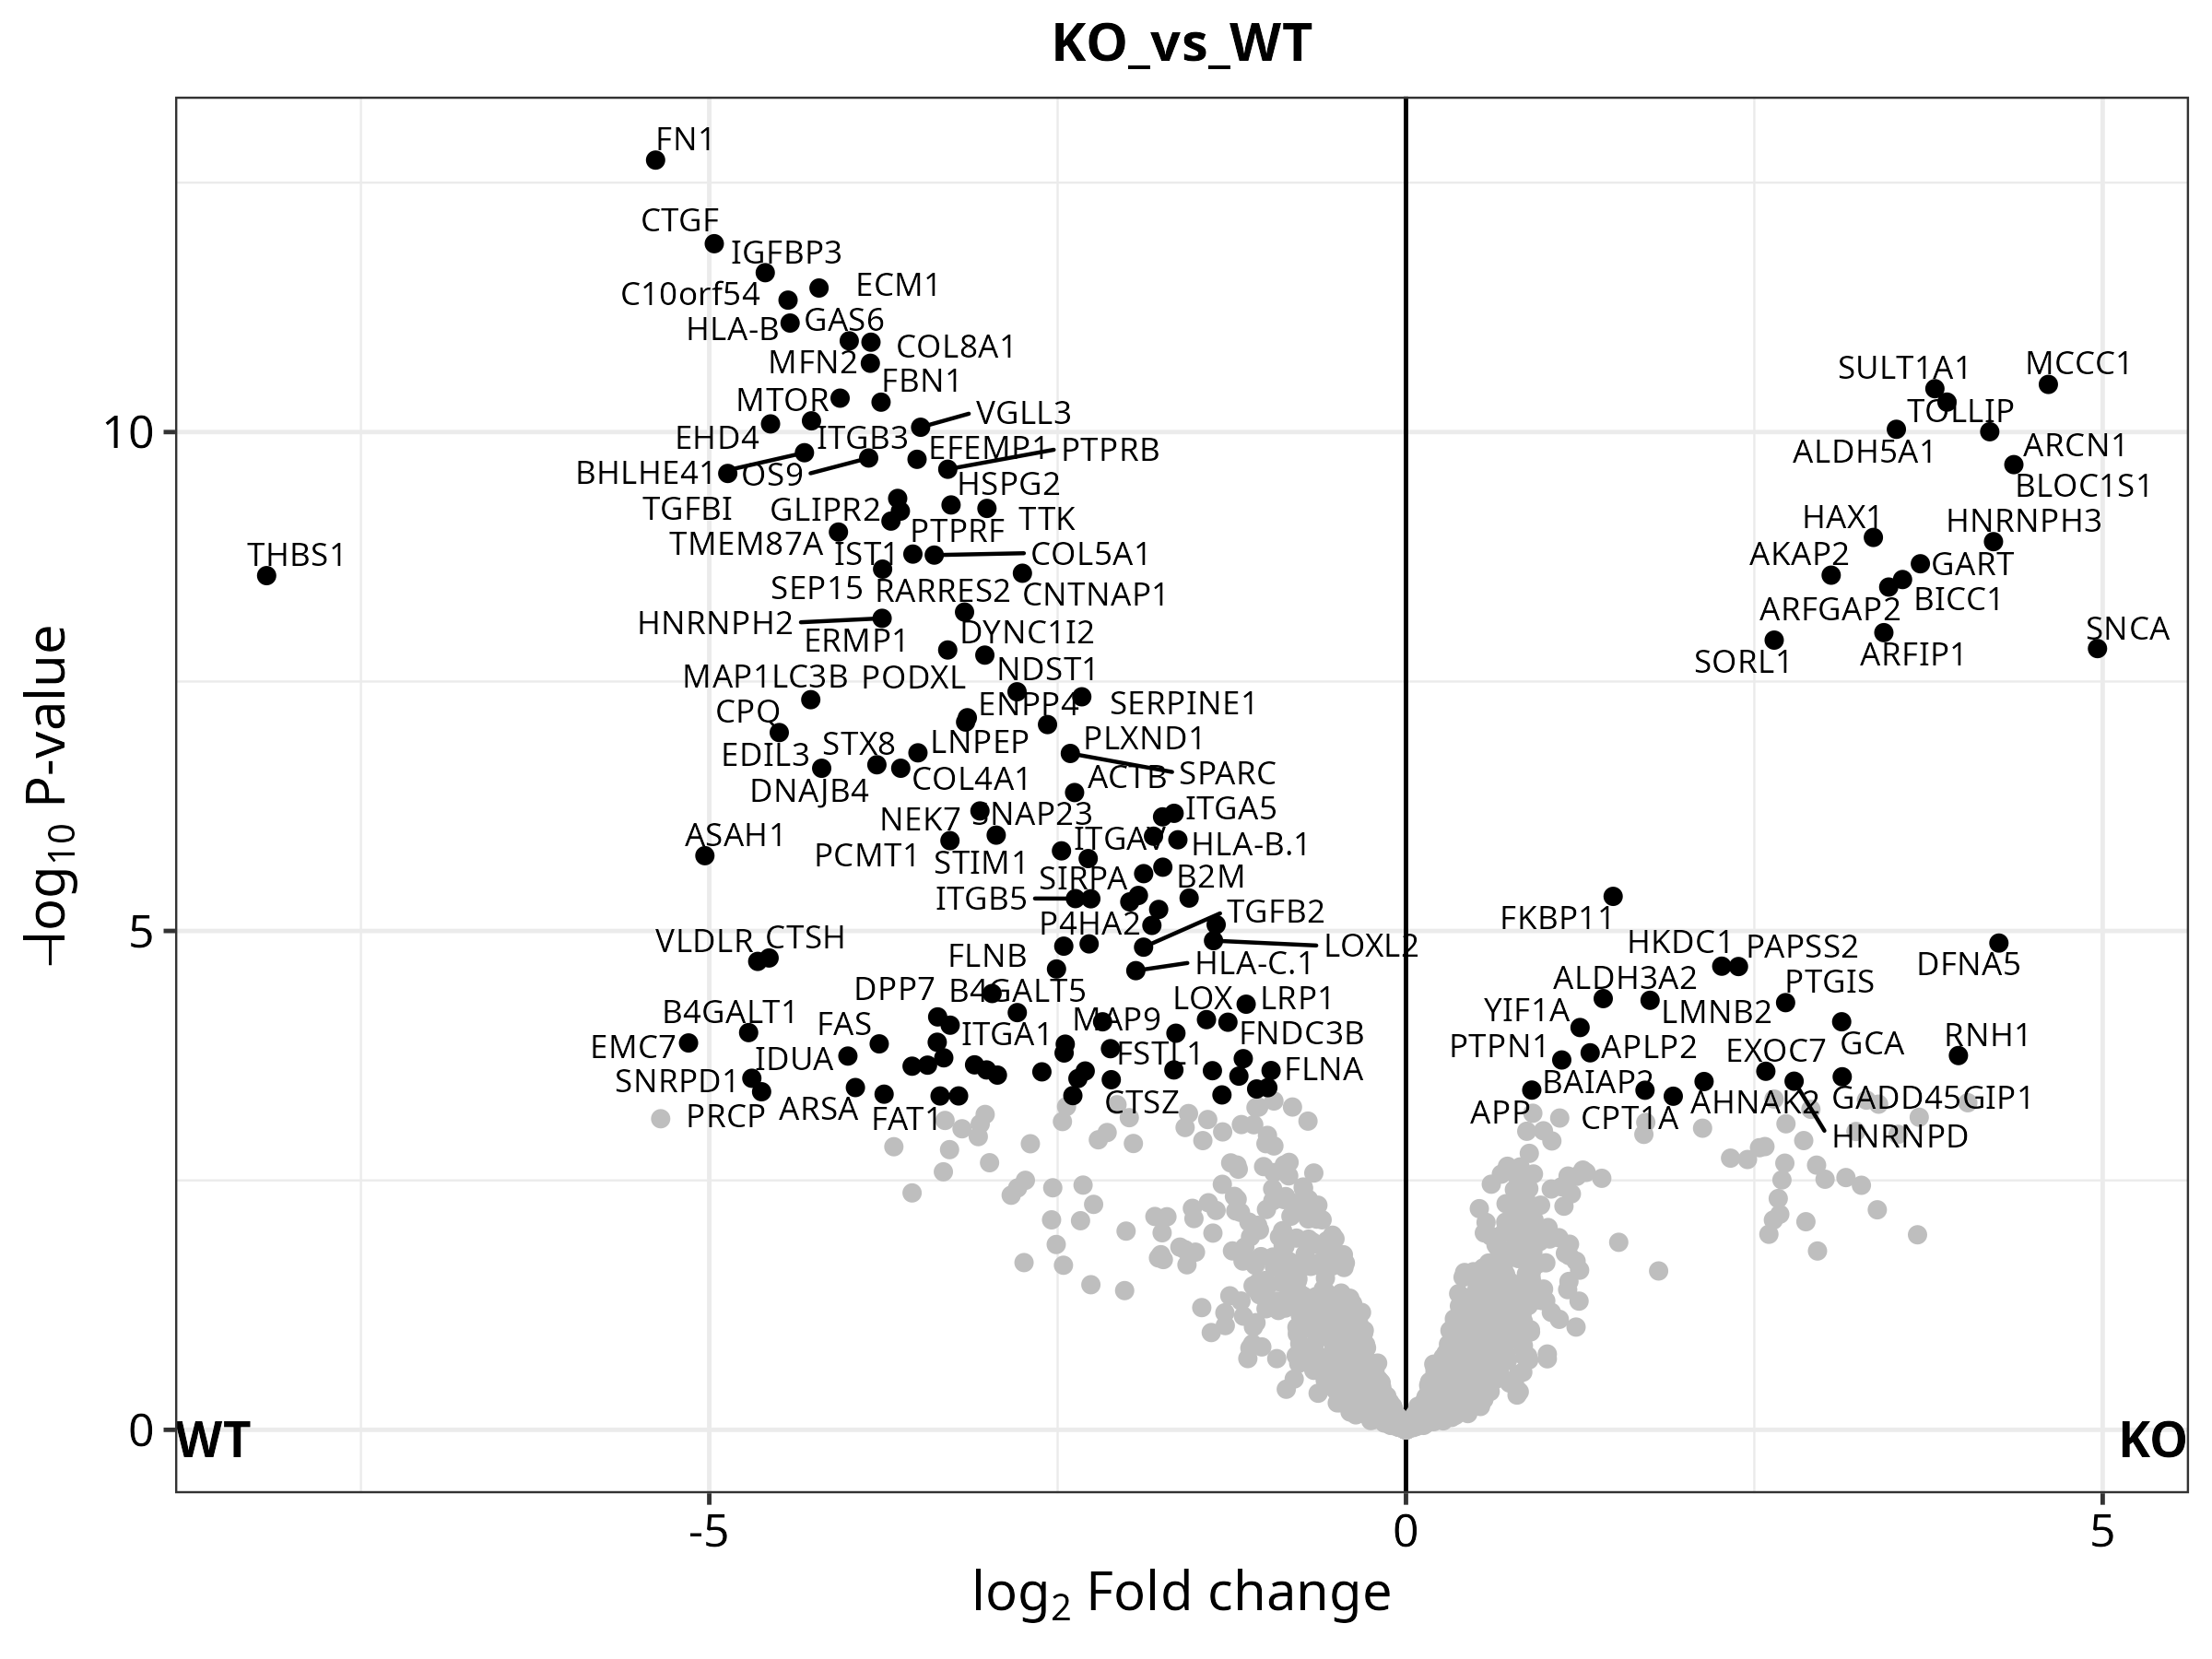
F --> G["limma · empirical Bayes · ~0 + condition · manual contrasts"]
G --> H["Log2FC · p-value · BH-adjusted p · UP / DOWN / NO per comparison"]
end
subgraph VIZ ["3 · Visualisation"]
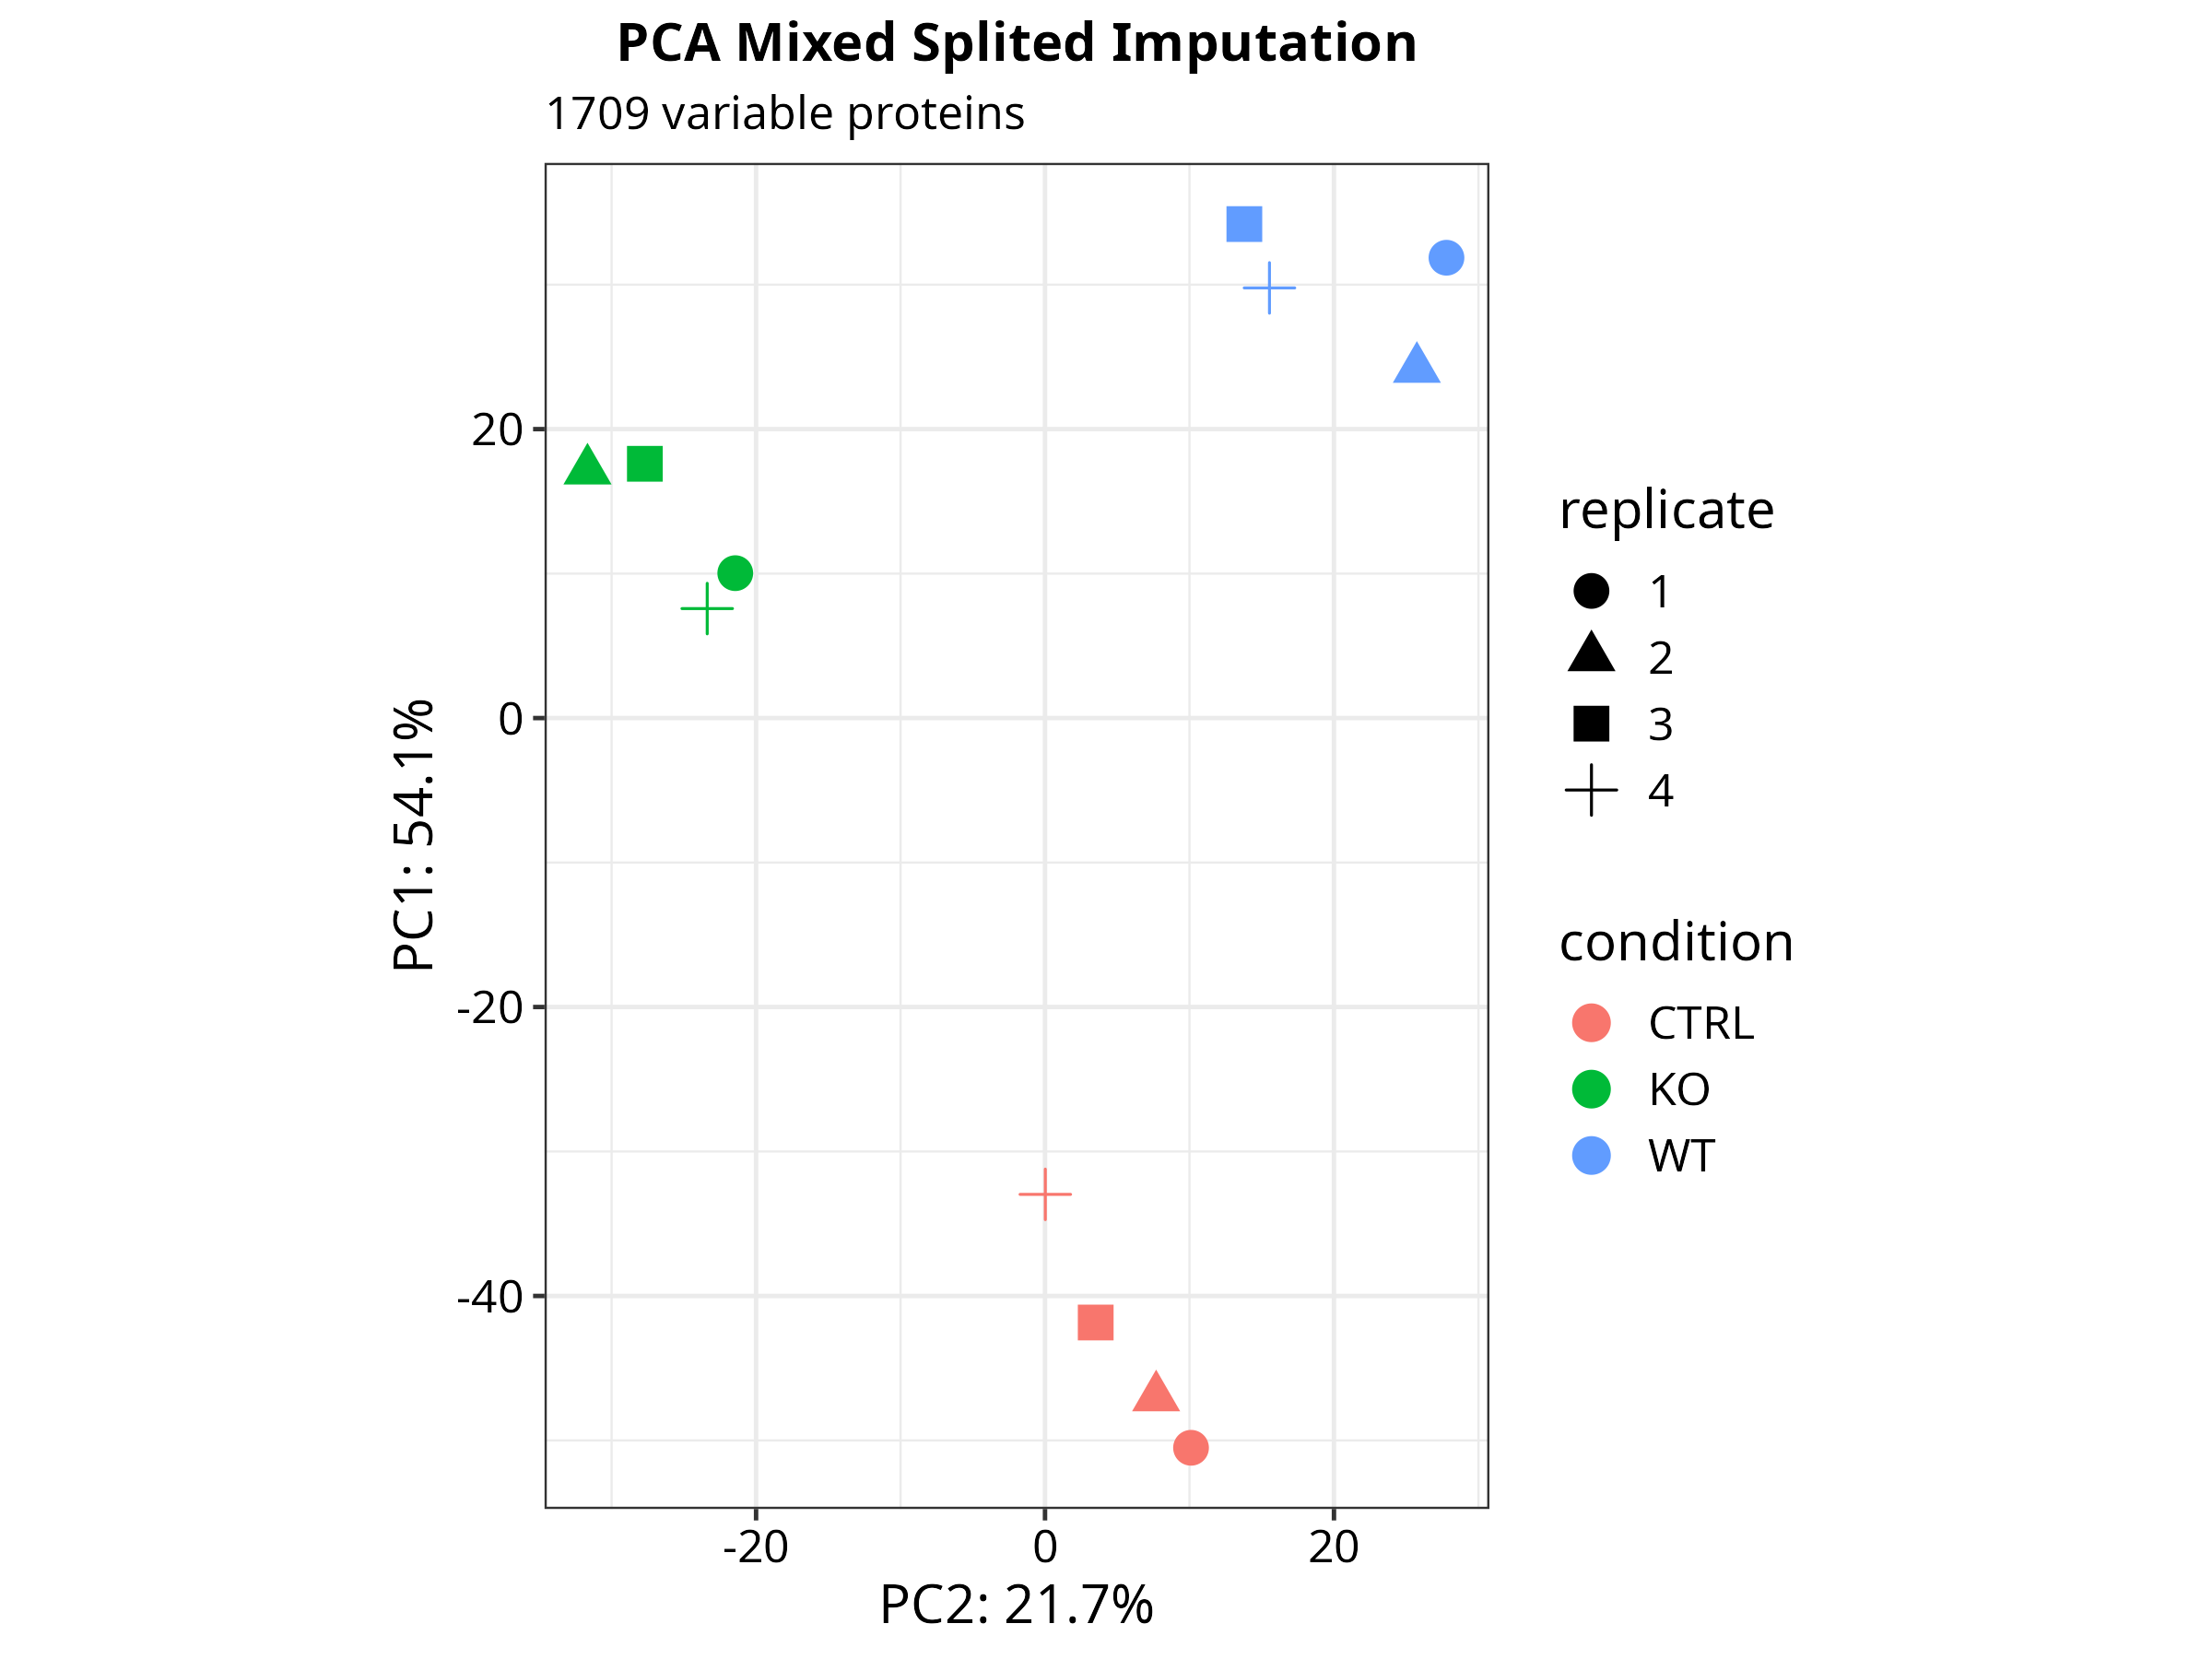
H --> I["Volcano plots · Heatmaps · PCA · UpSet"]
end
subgraph ENRICH ["4 · Functional Enrichment"]
H --> J["ORA — enrichGO · GSEA — gseGO · gseKEGG · pathview"]
H --> K["STRING PPI networks · PANTHER · EnrichR"]
end
subgraph SUMM ["5 · Summary"]
I & J & K --> L["Statistics tables · DE counts · effect sizes"]
end
style QC fill:#1e3a5f,color:#fff,stroke:#1a7a7a
style DE fill:#1e3a1e,color:#fff,stroke:#22c55e
style VIZ fill:#3a1e1e,color:#fff,stroke:#ef4444
style ENRICH fill:#3a2a1e,color:#fff,stroke:#f59e0b
style SUMM fill:#2a1e3a,color:#fff,stroke:#8b5cf6
Key Technical Details
- Differential expression via
DEP::analyze_dep()wrapping limma with flexible manual contrasts - Configurable imputation:
fraction_NA,factor_SD_impute, and MNAR method selection - Automated directory structure and sequential figure numbering for reproducible outputs
- Dual export (TIFF raster + PDF vector) for all figures
- Gene identifier mapping through biomaRt and AnnotationDbi (UNIPROT → ENSEMBL/ENTREZ)
Example Application — CLN3 Lysosomal Interactome
The repository includes a complete analysis of the CLN3 lysosomal interactome in human cell lines (ProteomeXchange PXD031582), comparing CTRL vs WT vs KO conditions across 12 samples and 3 pairwise contrasts.
Calcagni’ et al. Loss of the batten disease protein CLN3 leads to mis-trafficking of M6PR and defective autophagic-lysosomal reformation. Nat Commun 14, 3911 (2023). doi:10.1038/s41467-023-39643-7
Output Gallery
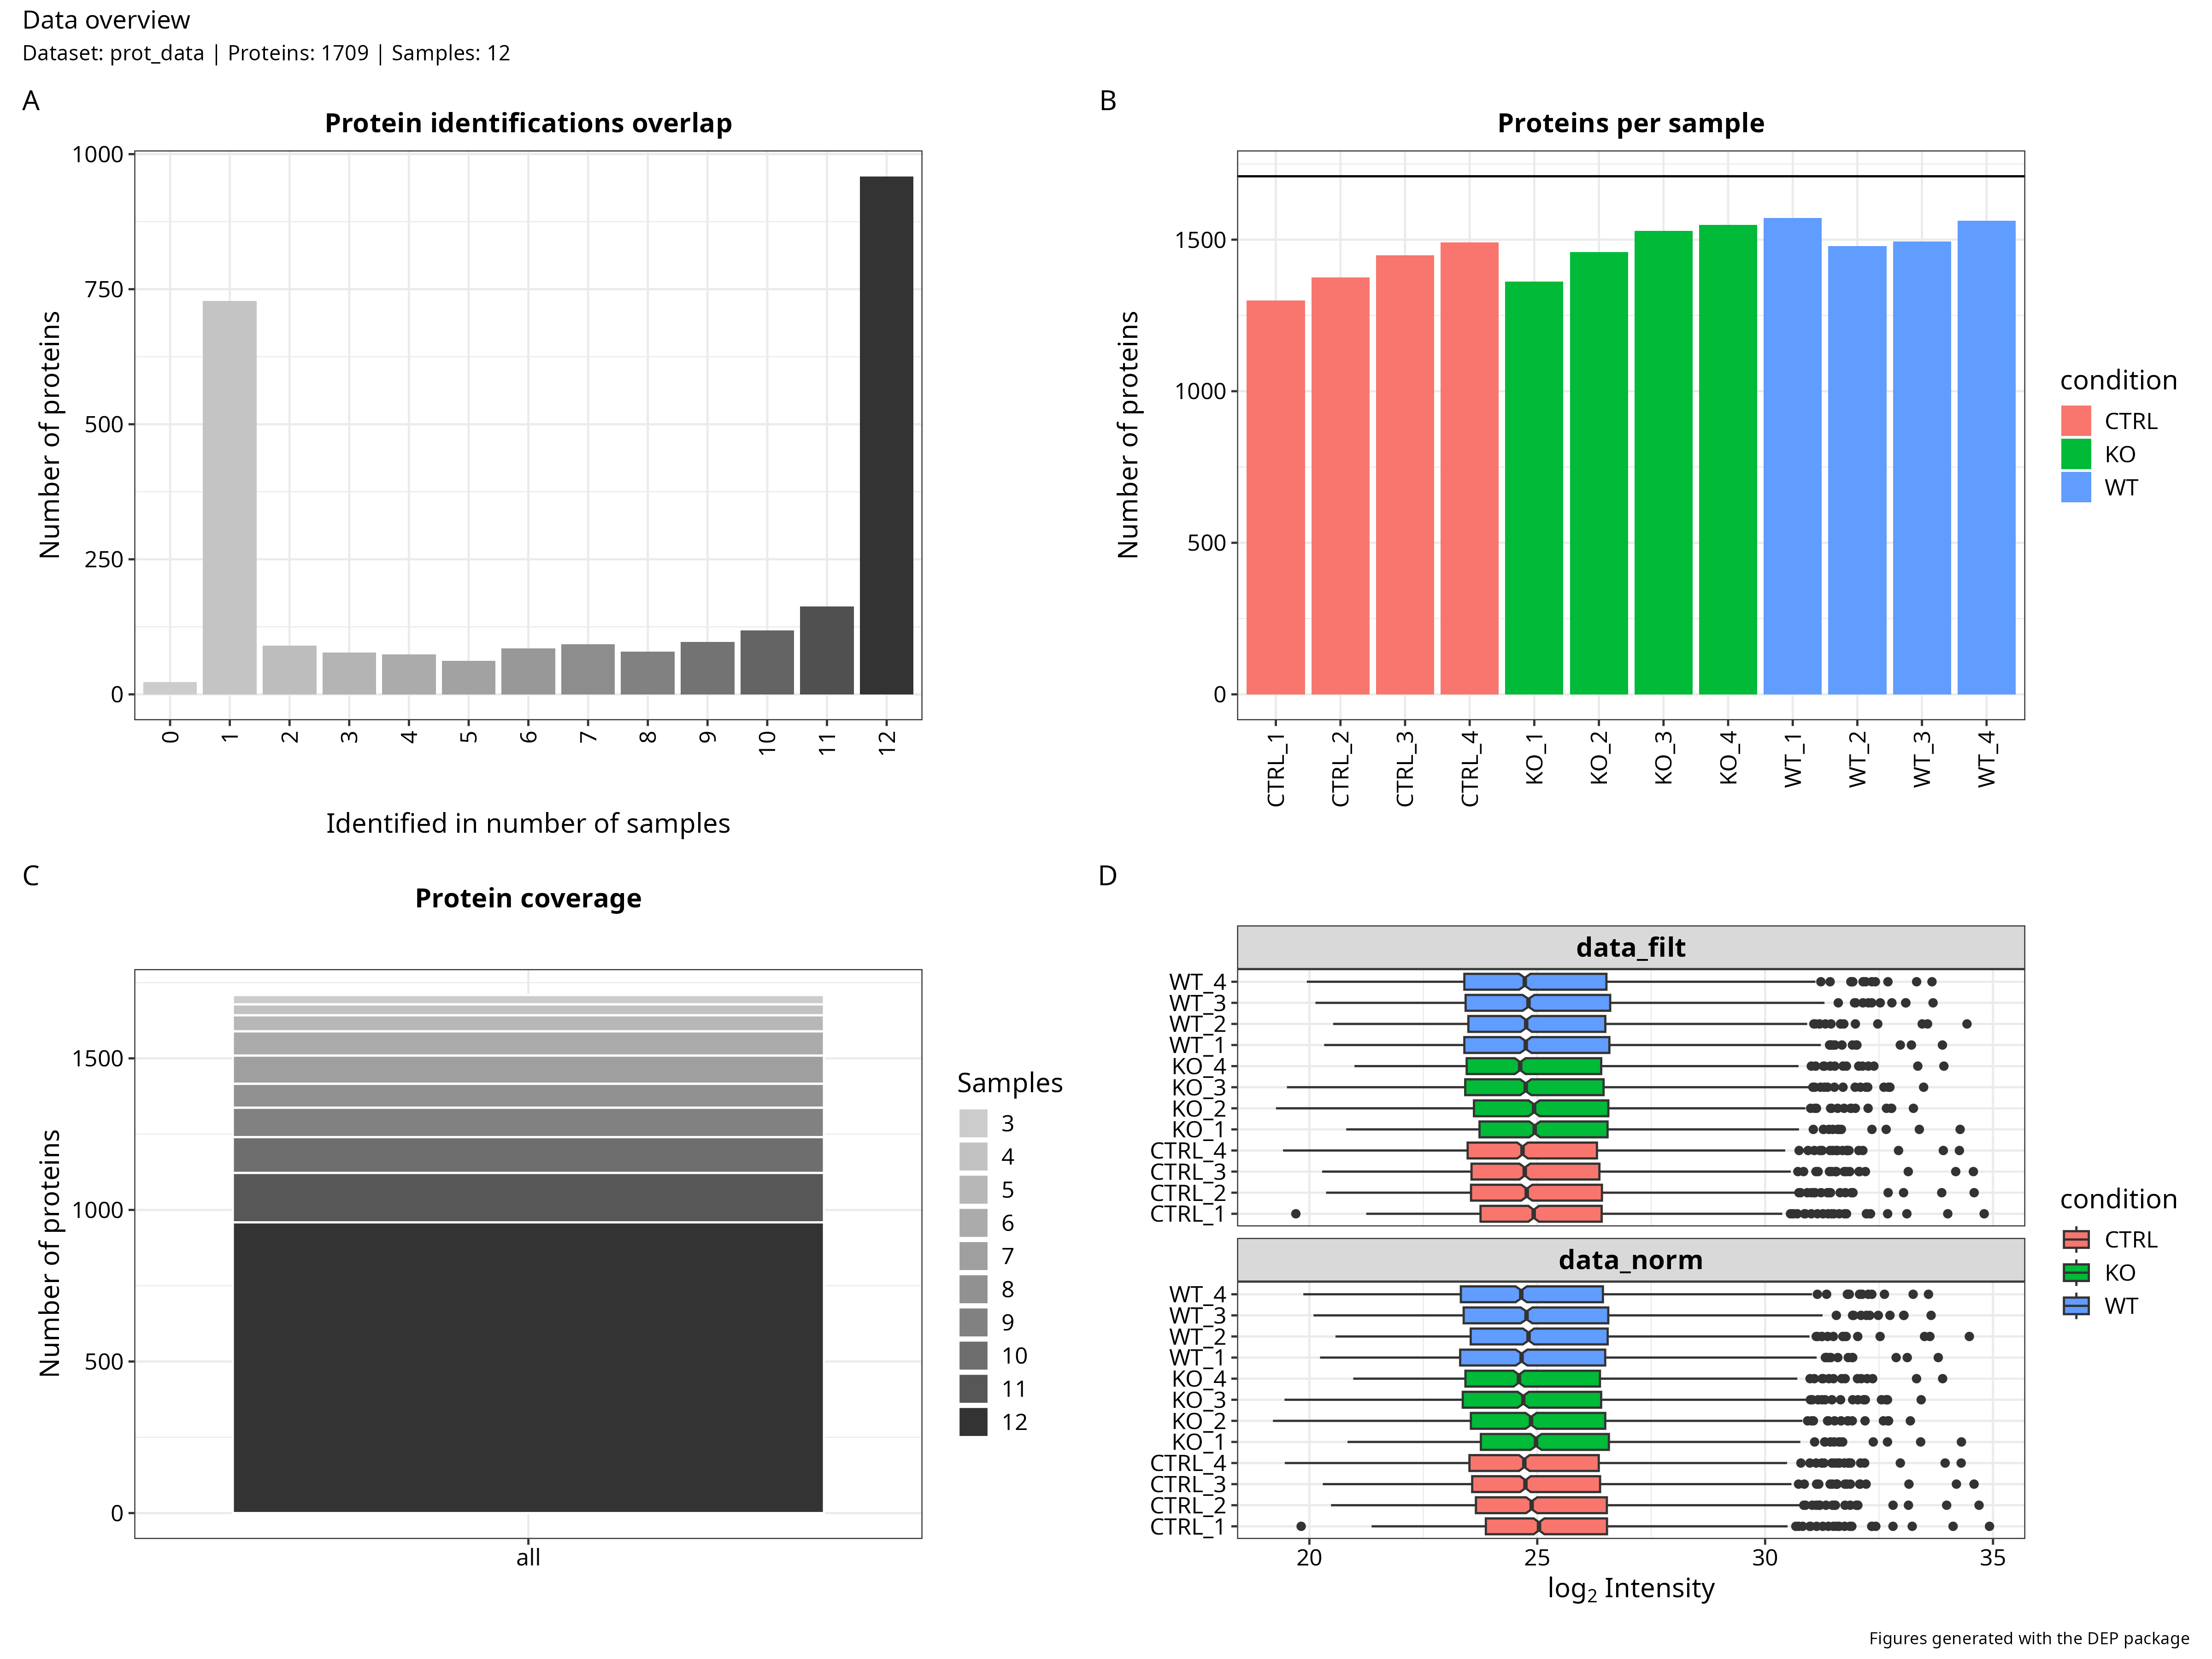
Quality Control & Normalisation
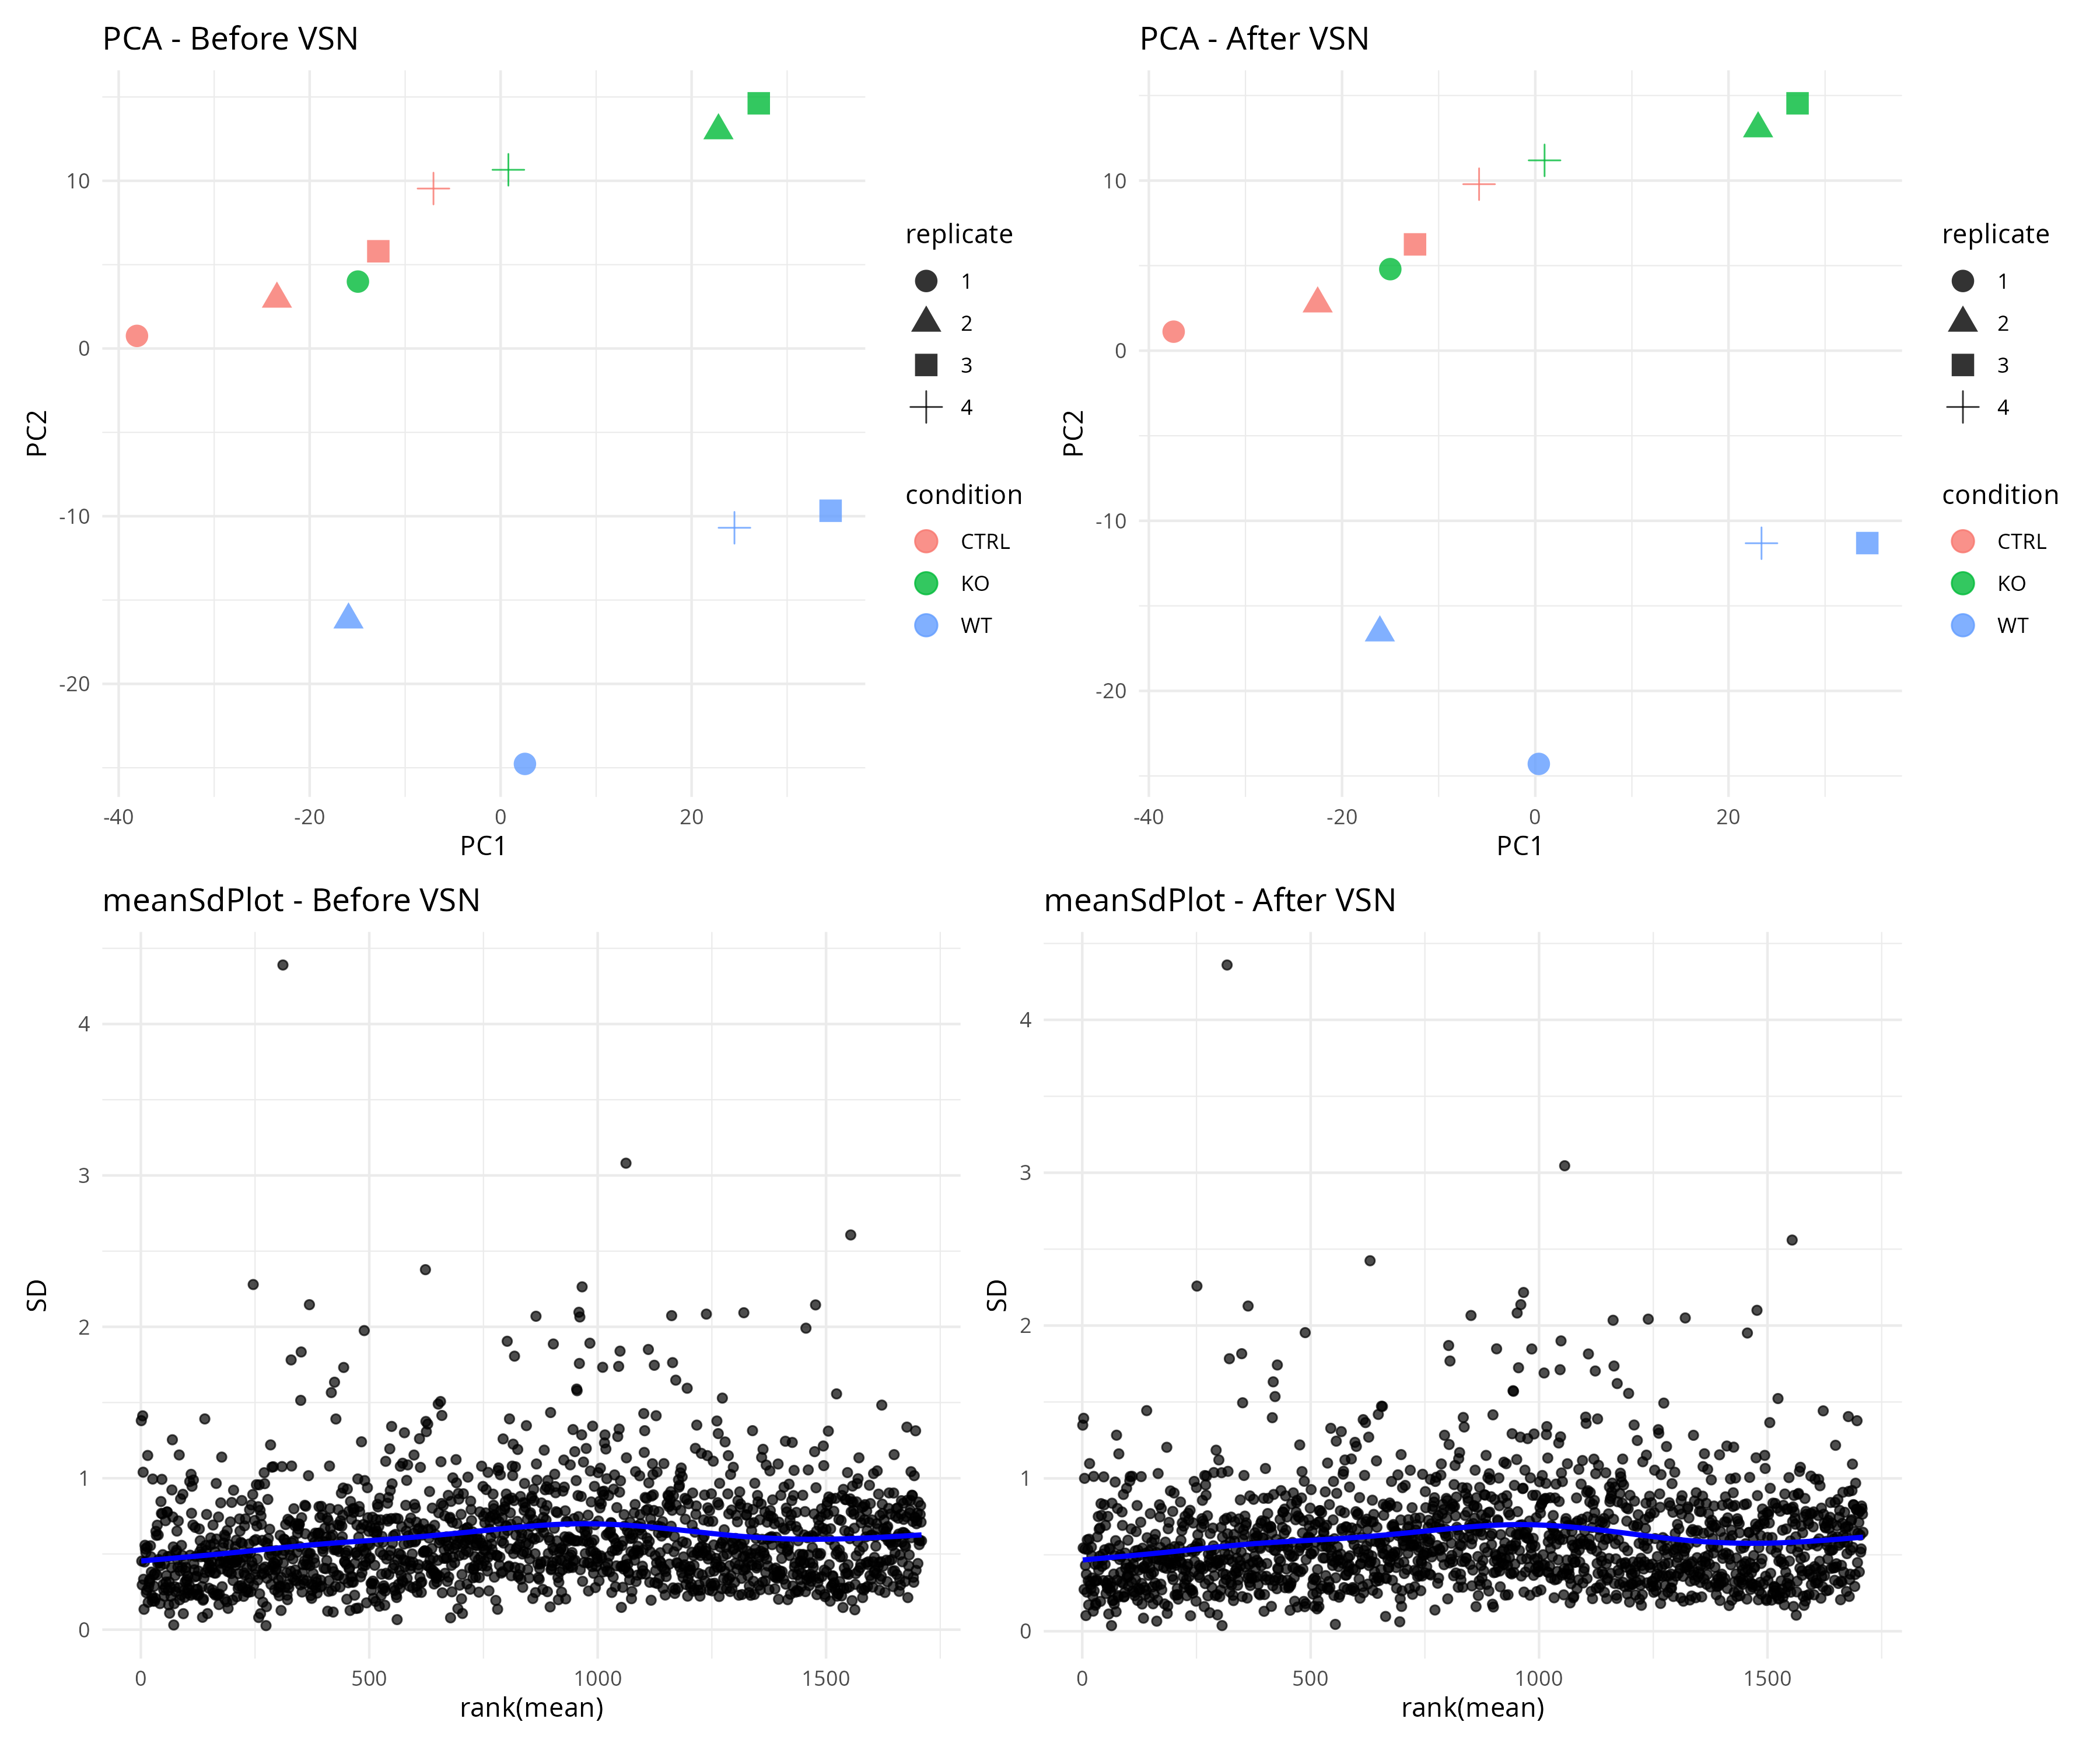
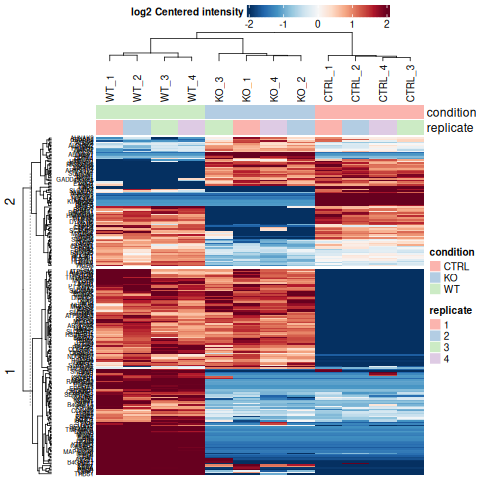
Dimensionality Reduction & Differential Expression
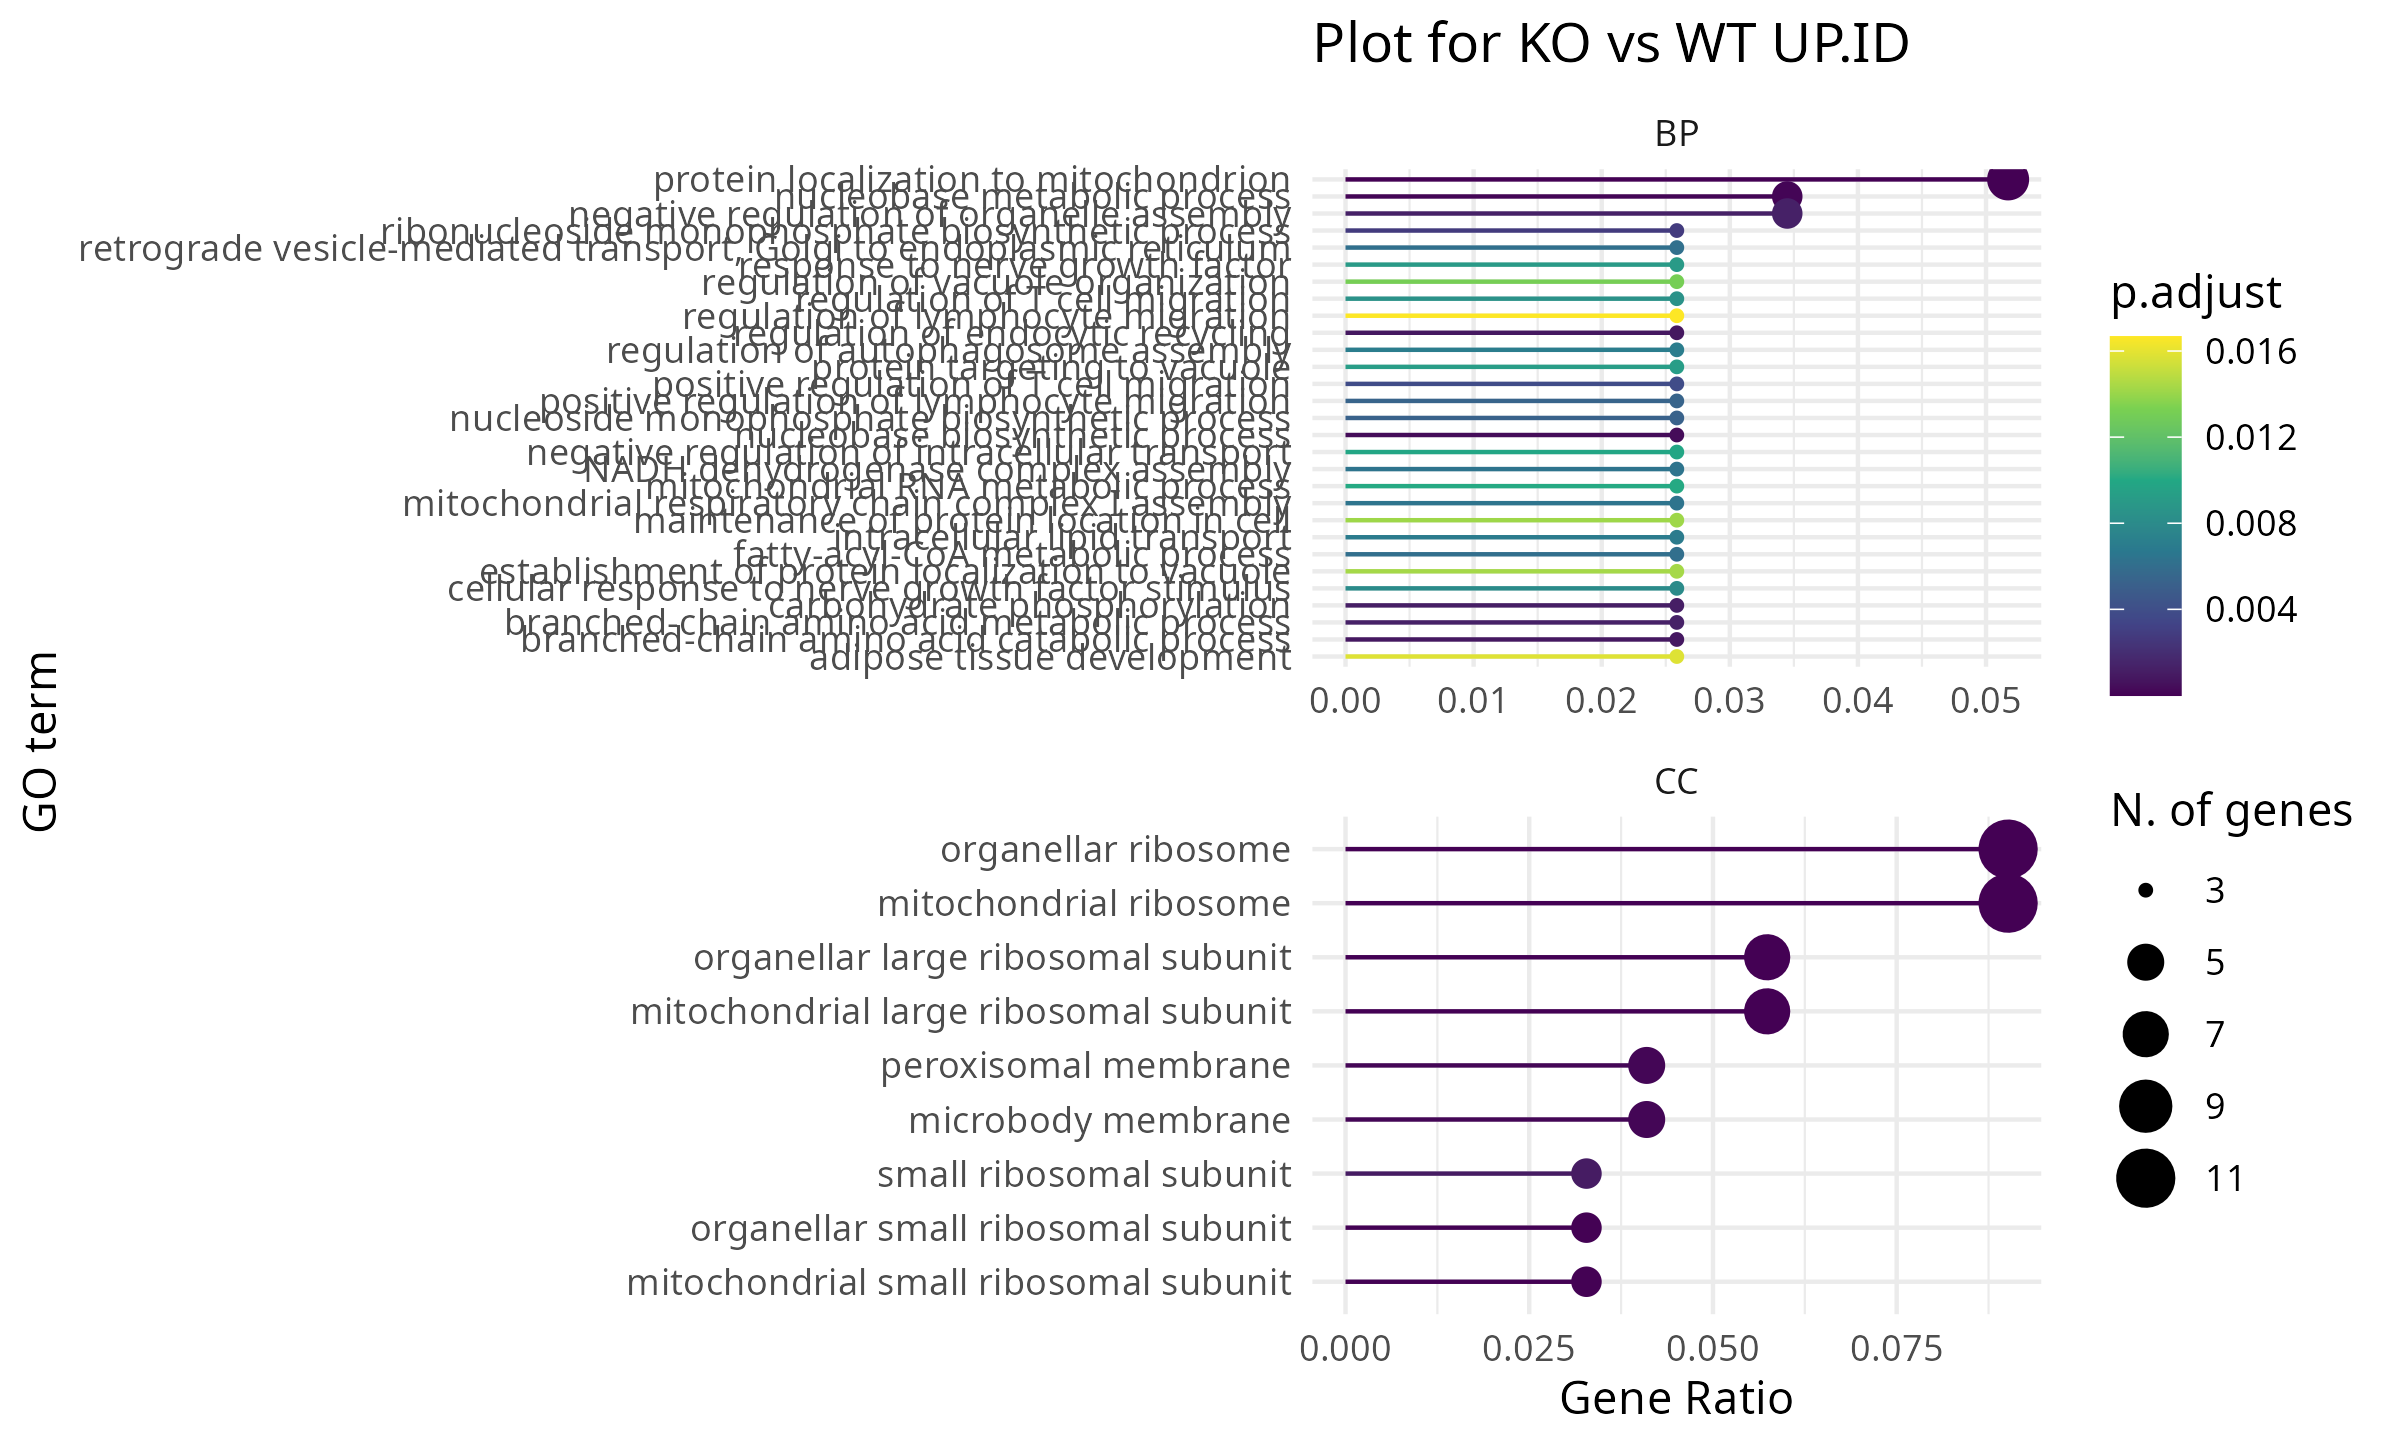
Clustering & Functional Enrichment